
Power BI Certification Training Program
Microsoft Power BI Training | Power Bi Certification Program
Power BI—which combines Power BI Services, Desktop, and Mobile into a formidable business intelligence and analytics package. In this Power Bi Training Course, we teach you how to get the most out of this toolset.
The Power Bi Certification Training Program includes Data Modelling, Power Query, Dax, Visualization and Power Bi Service.
Learn how to connect to external data sources and upload CSV and Excel files, and then use Power BI Pro to create insightful reports, visualizations, and dashboards, complete with charts and maps. Get further insights from your data with Power BI Q&A and Microsoft Cortana, and then share the results with colleagues.
Why should a Corporate Company Invest in Microsoft Power Bi?


Are your employees Using Excel to Analyse Data?
Have they Tried to Analyse a Million Records in Excel?
#Reason 1: What is POWER BI?
Power Bi & Power Pivot is Built to work with data scale which is Huge, in Millions, if you simply Google “How many Records can we Analysed in Power Bi ” You will get the answer.
Are you a Corporate employee?
How can Power BI enhance your skills of analysis? Discuss With Us
#Reason 2: Learn Power Bi Dashboards
Have you tried to create a Dashboard in Excel?
In the Power Bi Training Program, you will learn to create Interactive Dashboards.
Interact with our Dashboard, Go ahead and try it out – click on the chart, and watch it respond (maximize to full screen for better visibility):
What Dashboard’s will YOU be creating, In the Power Bi Training Program?
In the Power BI Training Program, you will learn to create Dynamic, Interactive Dashboards.
These dashboards would have Data from multiple data sources. Dashboards created in Power Bi can also be shared using the Power BI Service Features.
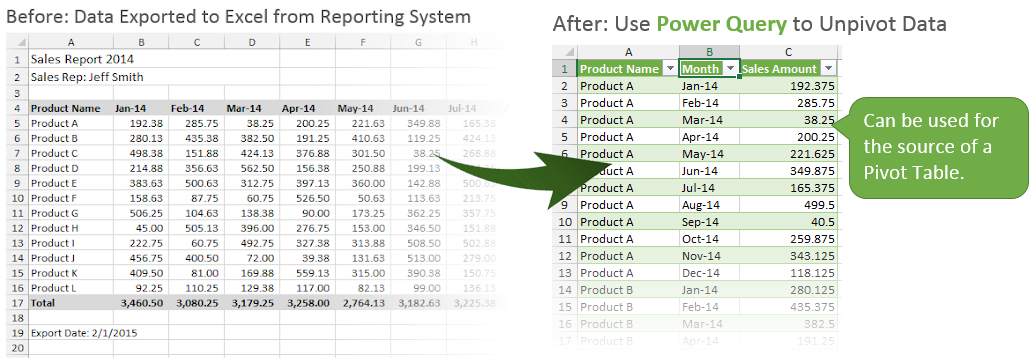
#Reason 3: Learn Power Query
Can you Create a Pivot Table of This DATA? on the basis of Month, under Rows?
Using Power Query, you will be able to convert this data, into the desired results within seconds.
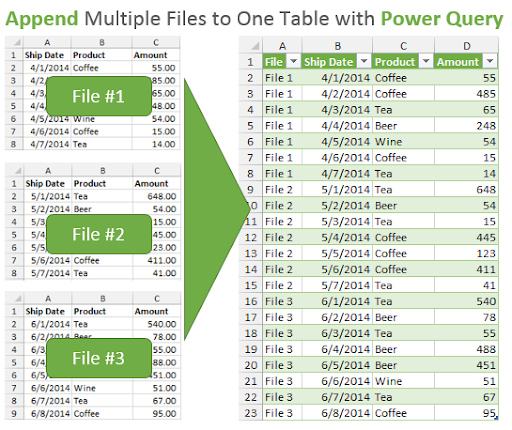
We get Data every Month or from multiple branches, with a click of a Button, we want to Append the different Data Set’s.
#Reason 4: DAX
Data Analysis Expressions (DAX) is a library of functions and operators that can be combined to build formulas and expressions in Power BI Desktop, Azure Analysis Services, SQL Server Analysis Services, and Power Pivot in Excel.
Using Dax, you start Asking Questions to your Data Model.
- For Example Top 5 Clients in Mumbai City?
- Create Year to Date Analysis for Sales
- Calculate Sales, for Same Period Last Year and Many More…
Do you represent a Corporate Company?
How can Power BI be an asset to your company? Discuss With Us
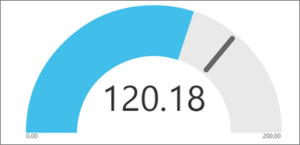
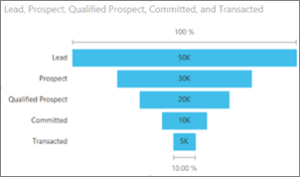
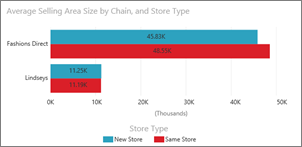
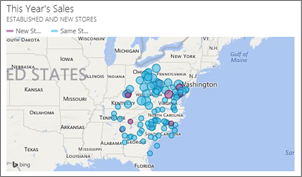
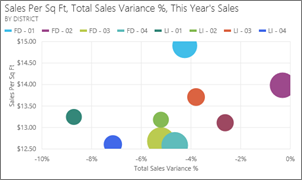
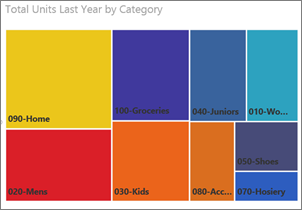
#Reason 5: Power Bi Training for Visualization:
In the Power Bi Training Program, you will learn the multiple visualization which Power BI has to offer.
Top 5 Reasons To Take Our 1:1 Free Counseling Session On Power BI Training
Introduction To Dashboards
Glimpse of Interactive dashboards which you will be creating during the Power BI training program
Power BI Certification Training Program Module 1: Introduction to Self-serve analytics and business intelligence tools
- SSBI Tools
- What is Power BI, & Benefits?
- Power BI – Structure, Components, Requirement’s
- Building Blocks of Power BI – Getting Started
- Power BI – Primary Tools : Power Pivot, Power Query, Power View, Power Map
- Integrated into Once Model, Power BI
- Loading large data into Power Query
- Consolidation of data from multiple files/multiple folders
- Consolidation of data from multiple sheets
Power BI Certification Training Program Module 2 : Modelling Data
- Merging tables and queries
- Doing simple to complex automated lookups
- Multiple joint in PQ
- Data transformation and cleaning data
- Pivoting & unpivoting data
- Column transformation & Cleaning
- Row transformation & conditional logic cleaning
- Camping & summarizing data
Power BI Certification Training Program Module 3: Power Pivot
- Introduction to PowerPivot
- Overview of the environment
- Getting data into PowerPivot
- From Databases
- From Excel Files
- From Power Query
- Copy Pasting Data
- Calculated Columns
- Creating Calculated Columns
- Using RELATED function – the lookup of PowerPivot
Power BI Certification Training Program Module 4: Analyses
- Analyse (using power pivot)
- This sector will focus on doing powerful analysis
- Data Sources and Connections. Connecting to multiple sources of Data
- How to use Query Editor in Power BI, Editing Data in Power Bi, Changing
- Datatypes, Create Calculated Columns
- Advanced Data Changes and Transformation to Data
- Views in Power BI Desktop
- Modeling Data – Manage Data Relationship, 1-1/ 1- Many Relationship of Data
Power BI Certification Training Program Module 5: Relationships
- Working with multiple tables
- Diagram and Data views
- Defining relationships
- Editing and Handling Multiple Relationships
Power BI Certification Training Program Module 6: Power Query
- Understanding Power Query environment
- Loading large data into Power Query
- Consolidation of data from multiple files/multiple folders
- Consolidation of data from multiple sheets
- Appending data
- Merging tables and queries
- Doing simple to complex automated lookups
- Multiple joint in PQ
Power BI Certification Training Program Module 7: Measures & Calculated Columns
- Measures in PowerPivot
- Implicit and Explicit Measures
- Understanding Filter Context
- Measure Referencing
- Editing / Deleting Measures
Power BI Certification Training Program Module 8 : Data Analyse Expressions (DAX)
- Learning Data Analyse Expressions (DAX) Functional Language
- Calculated Columns and Calculated Fields
- DAX Error Handling
- Overview of DAX Functions
- RELATED and RELATEDTABLE functions
- FILTER and ALL functions
- CALCULATE function
- Visual Totals and ALLSELECTED
- What is Time Intelligence in DAX
- Calendar Table
- Counting Working Days
- Multiple Calendar Tables
- DAX Filter Functions : CALCULATED
- Performing arithmetic & aggregation operations on large data
- Writing statistical and logical DAX patterns
- DAX creative formulas : SUMX() and other X Functions
Power BI Certification Training Program Module 9 : Data Visualization 1
- Different Types of Data Visualization
- Practices for Data Visualization, Using Different Components, Visuals
- Creating Reports in Power BI
- Charts in Power BI (Scatter, Waterfall, Funnel)
- Slicers in Power BI
- Map Visualizations, for Creating Dynamic Maps Connected to Location Mentioned in Data
- Gauges and Single Number Cards
- Understanding Power View Features
- Using Filters for interactivity
- Understanding different visualization
- Tables
- Matrix
- Cards & More
- Understanding different visualization
- Line
- Bar / Column
- Pie
Power BI Certification Training Program Module 10 : Data Visualization 2
- Using Maps
- Understanding Drill Down’s
- Using Titles
- Understanding Multipliers
- Tables
- Matrix
- Cards & More
Power BI Certification Training Program Module 11: Q&A Data Insights
- Power BI Q&A
- Creating Dashboard & Sharing
- Dashboard v/s Reports
- Creating a Dynamic Dashboard With Multiple Charts & Data Set’s
- Creating Dashboard Tiles
- Pinning Tiles to Dashboard
- Quick Insights with Power BI
- Power BI Publisher for Excel
Power BI Certification Training Program Module 12: Advanced Topics
- Filter Context
- Calculate
- Row Context
- Evaluation Context and Relationships
- Context Transition
- All Selected
- Advanced Dax Functions & Patterns
- RankX
- KeepFilters
- Event in progress
- Time Intelligence DAX Functions
- Calendar Table
- Counting Working Days
- Multiple Calendar Tables
- Aggregations over Time
- Creating Advance Dashboard
- Get Participant’s to work on their Data

I did online training for Power Query & DAX from Compufield. Our trainer Mr. Faiyaz is a thorough professional with complete knowledge of the subject, and he makes sure everyone has understood the concept before starting any new topic.

Owais Qureshi

We had a training in HRIPL for power BI by Mr. Faiyaz Compufield. It was a great learning in power query, DAX and now we know how to talk to data. The trainer Faiyaz has a very good convincing and training skills and use examples as per your level. He understand the issues and give personal focus to each students. thanks for such a wonderful training.. will have more..
Vivek Singh

Attended Corporate Training for Power Bi & DAX by Mr. Faiyyaz. Excellent session, comprehensively delivered from the very basic concepts to the most advanced ones passionately while clearing all queries on the fly. Would highly recommend the session.
Haroon Ahmed

Amazing training. I was able to prepare excel dashboards for my organization with their teachings and methods. Even my doubts were solved. Special thanks to Sabiha ma'am and Shaziya ma'am for their training.
Harsh Malhotra

I am a student of Xavier Institute of Communications and I undertook a course on Microsoft Excel by Faiyaz Khairaz sir and it was super interactive and fun! The content is very relevant and the teaching style made it easy to comprehend. Would recommend to anyone looking to grab similar skills!
Sonaali Malhotra

have done the online learning from Faiyaz on powerbi and power queries and I found his training extremely useful. Faiyaz explains the topic really well and he follows the problem solving method when teaching. This method is extremely effective when learning, remembering and applying the technique in the real world working environment. This has already made a lot of my routine tasks automated.
Amit Thakrar


