
Power Pivot-Dax Course In Mumbai
Duration: 3 Days
How Do We Conduct Online Corporate Training ?
About Power Pivot
Power Pivot is a feature of Microsoft Excel that was introduced as an add-in to Excel 2010 and 2013, and is now a native feature for Excel 2016 and 365. As Microsoft explains, Power Pivot for Excel “enables you to import millions of rows of data from multiple data sources into a single Excel workbook, create relationships between heterogeneous data, create calculated columns and measures using formulas, build PivotTables and Pivot Charts, and then further analyses the data so that you can make timely business decisions without requiring IT assistance.”
The most important and powerful feature of Power Pivot is its database − Data Model. The next significant feature is the xVelocity in-memory analytics engine that makes it possible to work on large multiple databases in a matter of few minutes.
Loading Data from External Sources
You can load data into Data Model from external sources in two ways −
(1) Load data into Excel and then create a Power Pivot Data Model.
(2) Load data directly into Power Pivot Data Model.
The second way is more efficient because of the efficient way Power Pivot handles the data in memory.
Power Pivot Data Model uses xVelocity storage, which is highly compressed when data is loaded into memory that makes it possible to store hundreds of millions of rows in memory.
Thus, if you load data directly into Data Model, you will be doing it in the efficient highly compressed form
For clarity, the key benefits of using Power Pivot vs. basic Excel can be summarised as the following:
It lets you import and manipulate hundreds of millions of rows of data where Excel has a hard constraint of just over a million rows.
It allows you to import data from multiple sources into one single source workbook without having to create multiple source sheets that suffer from version control and transferability issues.
It lets you manipulate the imported data, analyze it, and draw conclusions without slowing down your computer to a snail’s pace.
It lets you visualize the data with PivotCharts and Power BI.
Learn DAX : Data Analysis Expression
DAX is a Formula language written to a Pivot table.
DAX, has more than 200 function and counting. The rich DAX formula language includes libraries of incredible capabilities to perform computational gymnastics on your data and create powerful analytical data models.
DAX Language
The strength of Power Pivot comes from the DAX Language that can be used effectively on the Data Model to perform calculations on the data in the data tables. You can have Calculated Columns and Calculated Fields ( Measures )defined by DAX that can be used in the Power PivotTables and Power PivotCharts.
We start right from the Basics of DAX, understanding FILTER CONTEXT, CURRENT ROW CONTEXT, CONTEXT Transition, ALL, FILTER, RELATEDTABLE, CALCULATE, EARLIER, Relationships and much more.
How to Evaluate a DAX statement under different scenario’s, depending on your Data Model.
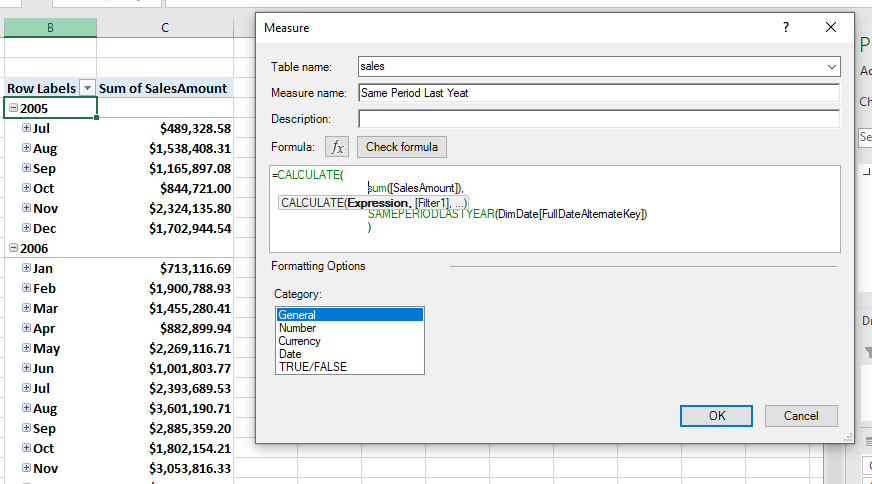
In the last phase of this course, you will learn about Time Intelligence and Date Tables. We will look at expressions such as TOTALYTD, SAMEPERIODLASTYEAR, DATESADD, DATESBETWEEN, CALENDERAUTO, and we will explore how many of these functions work using CALCULATE
Let’s take an example: Calculating the Sales for a Given Year, and to compare it with the Previous Year, on the basis of a Slicer.
This Advanced Excel Course will empower the participants to be able to do the following:
- Performing complex calculations more efficiently, using various Excel functions.
- Organizing and analyzing large volumes of data.
- Creating MIS reports.
- Designing and using templates.
- Consolidating and managing data from multiple workbooks.
Power Pivot-Dax Course Module 1: Introduction to Self-Service Business Intelligence
- Self-Service BI
- Power Pivot
- Power Query
Power Pivot-Dax Course Module 2 : Loading Data
- Loading Data in Power Pivot
- Loading from SQL Tables
- Loading from SQL Queries
- Using Linked Tables
- Loading from Excel
- Loading from Text Files
- Loading from the Clipboard
- Loading from Reports
Power Pivot-Dax Course Module 3 : Data Modelling
- Introduction to Data Models
- Normalization and Denormalization
- Star Schemas:
- Over Denormalization
Power Pivot-Dax Course Module 4 : DAX Language
- Introduction to DAX
- Calculated Columns and Calculated Fields (Measures)
- DAX Error Handling
- Overview of DAX Functions
- RELATED and RELATEDTABLE functions
- FILTER and ALL functions
- CALCULATE function
- Visual Totals and ALLSELECTED
Power Pivot-Dax Course Module 5 : Basic Time Intelligence
- What is Time Intelligence:
- Calendar Table:
- Counting Working Days
- Multiple Calendar Tables
- Aggregations Over Time
Power Pivot-Dax Course Module 6: Creating Reports and KPI
- Using KPI in Power Pivot
- Advanced Excel Features for Power Pivot
Power Pivot-Dax Course Module 7 : Advanced DAX Concepts
- Important DAX Concepts
- Filter Context
- CALCULATE Row Context
- Evaluation Contexts and Relationships
- Context Transition ALLSELECTED
Power Pivot-Dax Course Module 8 : Advanced DAX Functions
- Advanced DAX Functions and Patterns
- RANKX
- KEEPFILTERS
- Semi Additive Measures
- Event in Progress

I did online training for Power Query & DAX from Compufield. Our trainer Mr. Faiyaz is a thorough professional with complete knowledge of the subject, and he makes sure everyone has understood the concept before starting any new topic.

Owais Qureshi

We had a training in HRIPL for power BI by Mr. Faiyaz Compufield. It was a great learning in power query, DAX and now we know how to talk to data. The trainer Faiyaz has a very good convincing and training skills and use examples as per your level. He understand the issues and give personal focus to each students. thanks for such a wonderful training.. will have more..
Vivek Singh

Attended Corporate Training for Power Bi & DAX by Mr. Faiyyaz. Excellent session, comprehensively delivered from the very basic concepts to the most advanced ones passionately while clearing all queries on the fly. Would highly recommend the session.
Haroon Ahmed

Amazing training. I was able to prepare excel dashboards for my organization with their teachings and methods. Even my doubts were solved. Special thanks to Sabiha ma'am and Shaziya ma'am for their training.
Harsh Malhotra

I am a student of Xavier Institute of Communications and I undertook a course on Microsoft Excel by Faiyaz Khairaz sir and it was super interactive and fun! The content is very relevant and the teaching style made it easy to comprehend. Would recommend to anyone looking to grab similar skills!
Sonaali Malhotra

have done the online learning from Faiyaz on powerbi and power queries and I found his training extremely useful. Faiyaz explains the topic really well and he follows the problem solving method when teaching. This method is extremely effective when learning, remembering and applying the technique in the real world working environment. This has already made a lot of my routine tasks automated.
Amit Thakrar


